Network Monitor
The Network Monitor instrument displays information regarding the status of APs, along with channel information for both 2.4GHz and 5GHz. The operator is also able to see the status of any Ping Targets configured, SNMP Trap messages, and run Speed Tests.
Note: In cluster deployments, a Cluster Node field is displayed in applicable scaffolds to indicate which node the entry belongs to.
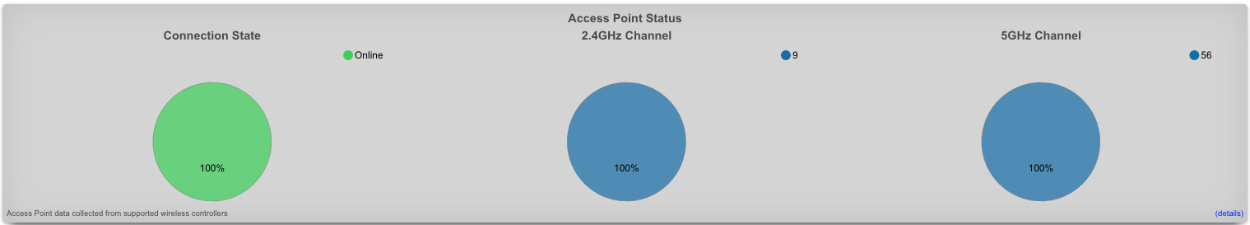
The above pie chart displays information on the percentage of APs that are online/offline, the channels used for 2.4GHz/5GHz, and what percentage of APs are on each channel.

Wireless Clients
The Wireless Clients scaffold displays the current devices connected to the wireless network. The IP field displays the client device's IP address. The MAC field displays the MAC address of the client device. The Hostname field displays the hostname of the device if known. The Login Session field displays the current login session for the device. The Account field displays the account the client device is attached to.
The OS Type field displays the operating system of the client device if known. The VLAN field displays the VLAN pool the VTA assigned to the device comes from, if applicable. The VLAN Tag field displays the VLAN tag number assigned to the client device. The TX Link Speed and RX Link Speed fields display the transmit and receive link speeds for the client device.
The Channel field displays the wireless channel of the AP the client device is connected to. The Access Point field displays the AP the client device is connected to. The WLAN field displays the SSID the client device is connected to. The Infrastructure Device field displays the wireless controller managing the AP the client device is connected to. The Status field displays the status of the client device.
The SNR field shows the signal-to-noise ratio (the difference between the received wireless signal and the noise floor). The RSSI field is a measurement of how well the device can hear a signal from the AP, with values closer to 0 being better. The Bytes To Client and Bytes From Client fields display the amount of data downloaded and uploaded by the client device.

Wired Clients
The Wired Clients scaffold displays the current devices connected on the wired infrastructure. The IP field displays the client device's IP address. The MAC field displays the MAC address of the client device. The Hostname field displays the hostname of the device if known. The Login Session field displays the current login session for the device. The Account field displays the account the client device is attached to.
The VLAN field displays the VLAN pool the VTA assigned to the device comes from, if applicable. The VLAN Tag field displays the VLAN tag number assigned to the client device. The Switch Port field displays the physical port the device is connected to. The Infrastructure Device field displays the name of the switch as configured in the wired infrastructure. The TX Link Speed field displays the link speed.

Ping Targets
The Ping Targets scaffold displays and configures the ping targets used to determine uplink availability and network health. Each uplink should have more than one ping target associated with it in order to properly determine uplink health.
The Name field is an arbitrary string descriptor used for administrative identification. The Online field indicates the current status of the ping target (whether it is responding to pings). The Target field shows the IP address or hostname that is pinged. The Updated At field shows when the ping target status was last updated.
The Uplinks field shows which uplinks are associated with this ping target for failover monitoring. The Interfaces field shows any specific interfaces associated with the target. The Access Points and Access Point Radios fields show wireless infrastructure used for client experience monitoring.
The RTT Tolerance field shows the maximum acceptable round-trip time in milliseconds. The Jitter Tolerance field shows the maximum acceptable latency variation. The Packet Loss Tolerance field shows the maximum acceptable packet loss percentage. The WLAN field shows the wireless network used for client experience ping tests. The FOM Configurable field indicates whether the ping target can be managed through Fleet Operations Manager.

Speed Tests
Speed Tests allow the operator to set up periodic speed tests to monitor the speed of a specific uplink, as well as speed tests from different points of the network, via an internet-based speed test or using iperf3 to monitor local network infrastructure.
The Name field displays the name of the speed test. The Test Type field displays the type of speed test being run (speedtest.net or iperf3). The Target field shows the target server for the test. The Passing field displays if the most recent test was a success or failure. The Last Result field displays the results of the last test run, including speeds achieved.
The Threshold Display field shows the conditions that need to be met for the test to be deemed a success. The Schedule Display field shows how often the test is performed. The Last Checked At field displays the date and time of the last check. The Next Check At field displays the date and time of the next scheduled check.
The Uplinks field displays the uplinks that the test runs against. The Infrastructure Areas field displays any infrastructure areas selected to run the test from. The Access Points and Access Point Radios fields show any wireless infrastructure used to run the tests.
Speed Test Results
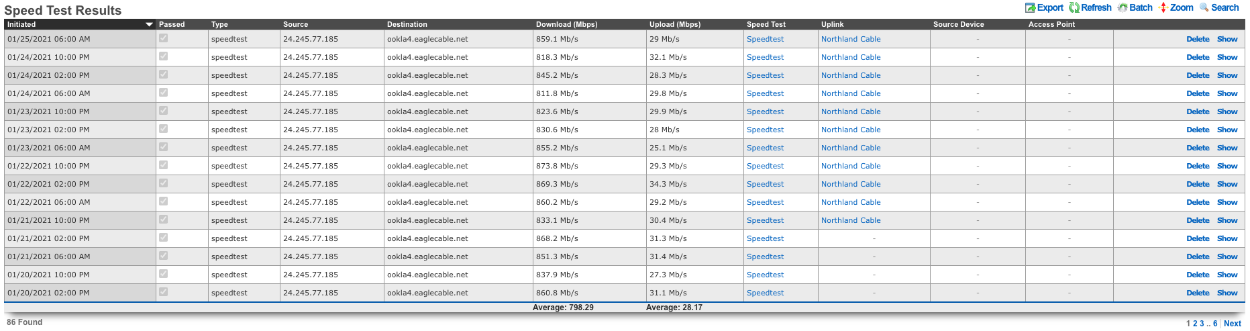
The Speed Test Results scaffold gives the operator a history of speed test results. The Initiated At field displays the date and time the test was performed. The Passed field displays if the test passed or failed. The Test Type field displays the type of test performed.
The Source field displays the IP address that was used at the time the test ran. The Destination field shows the server that the test ran against. The Download Mbps and Upload Mbps fields display the measured speeds of the test in megabits per second.
The RTT field shows the round-trip time latency. The Jitter field displays the latency variation. The Packet Loss field shows the percentage of packets lost during the test.
The Speed Test field displays the name of the speed test configuration that was run. The Uplink field displays the uplink that was used for the test if applicable. The Access Point field displays the AP used for the test.
The Tested Via Access Point, Tested Via Access Point Radio, and Tested Via Media Converter fields indicate which infrastructure device initiated the test. The Admin field shows if an administrator manually triggered the test. The PMS Room and Room Type fields show property management system information if applicable. The Is Applicable field indicates whether the result should be considered for threshold evaluation.
SNMP Traps

The SNMP Traps table displays SNMP trap messages received by the rXg from network devices.
The Received At field shows when the trap was received. The Source IP field displays the IP address of the device that sent the trap. The Infrastructure Device field links to the corresponding infrastructure device if configured. The Access Point field links to the access point if the trap originated from a managed AP.
The Uptime field shows the device uptime reported in the trap. The OID field displays the SNMP Object Identifier indicating the type of trap. The Payload field shows the trap data content.
The Acknowledged At and Acknowledged By fields indicate when and by whom the trap was acknowledged, if applicable.


