Logs
The logs view enables the operator to delve into the log files generated by the daemons that underly the rXg.
Numerous software modules are utilized to implement many of the features present in the rXg. During the course of normal operations, the software modules generate information which is stored in log files unique to the software module. The logs view enables the operator to browser through the log files for diagnostic purposes.
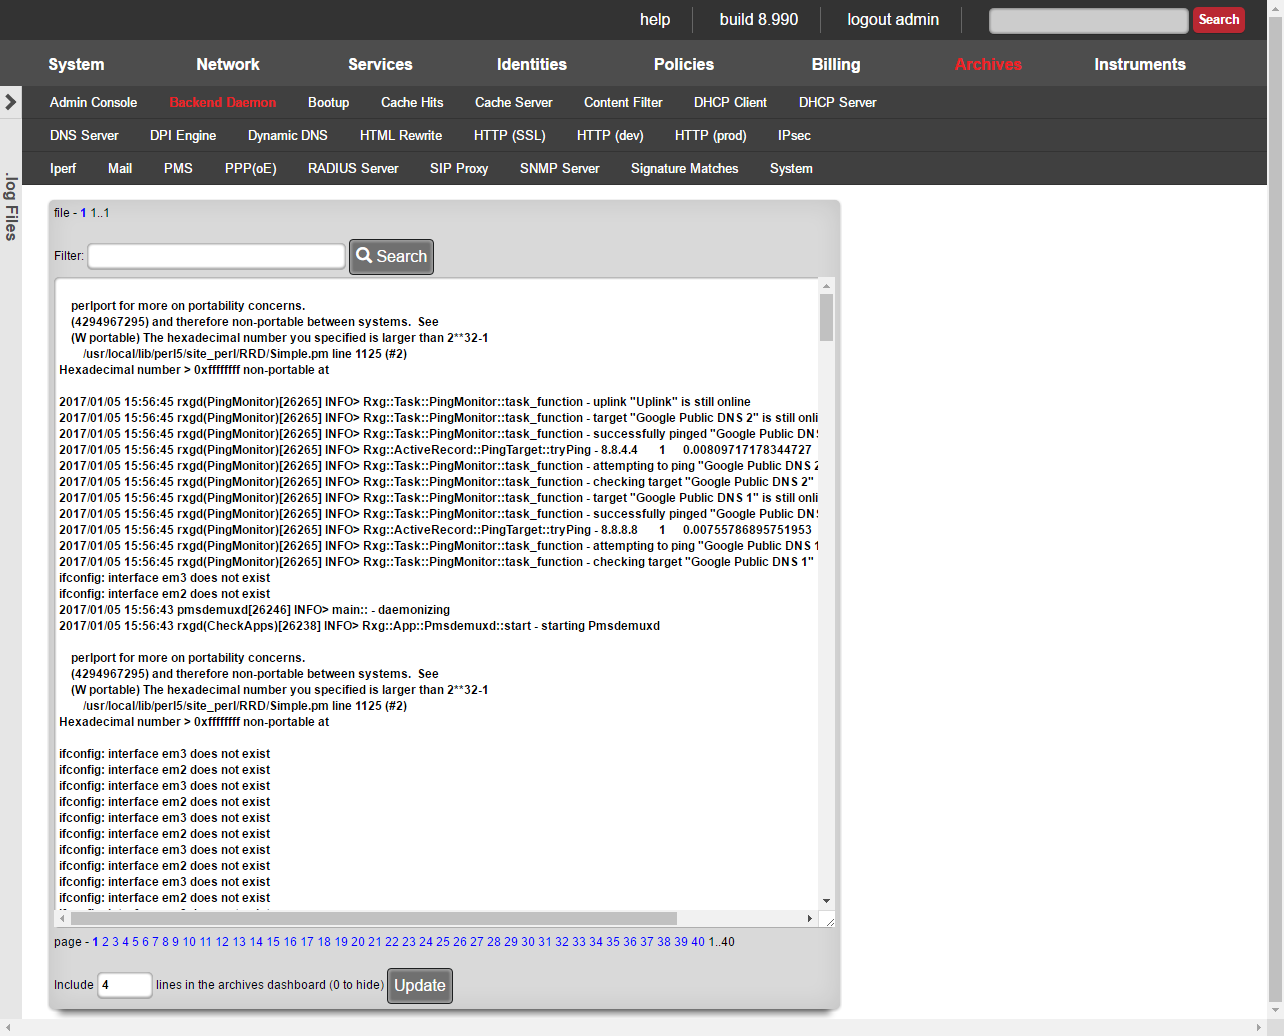
Log files tend to contain a large amount of data and become unwieldy after a while. The rXg rotates the log files periodically to mitigate size issue. As a result, the logs view contains several navigation mechanisms that assist the operator with browsing the available log files.
The menu near the top lists the names of the software modules. When a module name is clicked, the logs for the named module are brought into focus in the main dialog below. The name that is highlighted in red indicates the current module that is in focus.
The following logs are available:
Admin ConsoleA log of all actions that have been executed on the rXg administrative console along with the name of the administrator that executed the action and the IP address from which the request originated.Proxy HitsThe web proxy logs all request hits here. Proxy ServerThe web proxy logs global information and errors here. DHCP ClientInformation regarding the WAN links that obtain configuration via DHCP is logged here.DHCP ServerThe DHCP server logs global information and errors here. DNS ServerThe DNS server logs global information and errors here. DPI EngineThe deep packet inspection engine logs global information and errors here. Display MessagesOperating system kernel display messages are logged here.Dynamic DNSInformation regarding dynamic DNS servers via DHCP is logged here.HTTP (SSL)The web multiplexer that accepts HTTPS requests for the portal and console writes an entry for all requests in this log.HTTP (dev)The rails servers log here when in development mode. HTTP (prod)The rails servers log here when in production mode. IPsecThe IPsec engine logs connection information and errors here. HTML RewriteThe HTML payload rewriting engine logs information here.PPP(oE)Information about WAN uplinks that are configured for PPPoE is logged here.RADIUS ServerThe RADIUS server logs global information and errors information here.SNMP ServerThe SNMP server logs global information and errors information here.Signature MatchesThe deep packet inspection engine logs matches to configured rules here. System LogThe operating system logs errors and diagnostic information here.rXgThe rXg backend daemon logs diagnostic information and errors here. 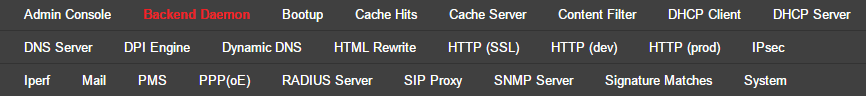
At the top of the main dialog is a series of numbers that follow the file label. These numbers represent the various log files that are present on the filesystem for the module chosen in the menu above. The file number 1 represents the current log file that the software module is writing to. The largest number represents the oldest log file that is still present on the rXg filesystem. The number in bold is the log file that is currently in focus.
The rXg periodically rotates the files and deletes the oldest one. The rotation policy depends on the software module. Most logs are rotated daily though some are rotated based on the size of the file. The rXg keeps at least a few rotations worth of log files on the filesystem at any given time to aid in troubleshooting.
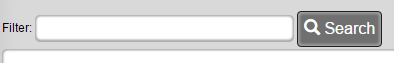
Many log files are thousands of lines long to it would be impractical to load entire log files into the browser. The main dialog displays on a slice of the log file chosen above. A series of numbers that follow the page label appear at the bottom of the main dialog that enables the operator to change the focus to a difference slice within the file. Smaller numbers represent slices at the top of the file while large numbers represent slices closer to the bottom. The number in bold represents the current slice of the log file.
At the bottom of the dialog there is a small textfield that allows the operator to enter the number of lines of this log that are desired for the archives dashboard. If the value is zero, then this log will be omitted from the dashboard. It is recommended that no more than five logs with five rows each be placed on the archives dashboard.


