Reports
The network graphs, system graphs, radio metric graphs and accounting graphs views allow the operator to view and configure the rXg graphing mechanisms.
The rXg includes a fully feature graphing package that allows operators to generate graphs for a wide variety data that is collected and stored on the rXg persistent storage. The graphs are divided amongst four views: network graphs, system graphs, radio metric graphs and accounting graphs.
- Network graphs - Interface rates, packet counts, etc.
- System graphs - Global operating system and service data such as the number of simultaneous logins and the number of entries in the ARP table at any given time
- Radio metric graphs - Graphs built from telemetry information ingested from the wireless infrastructure
The network graphs view contains the graphs of interface rates, packet counts, etc. The system graphs view contains the graphs of global operating system and service data such as the number of simultaneous logins and the number of entries in the ARP table at any given time.
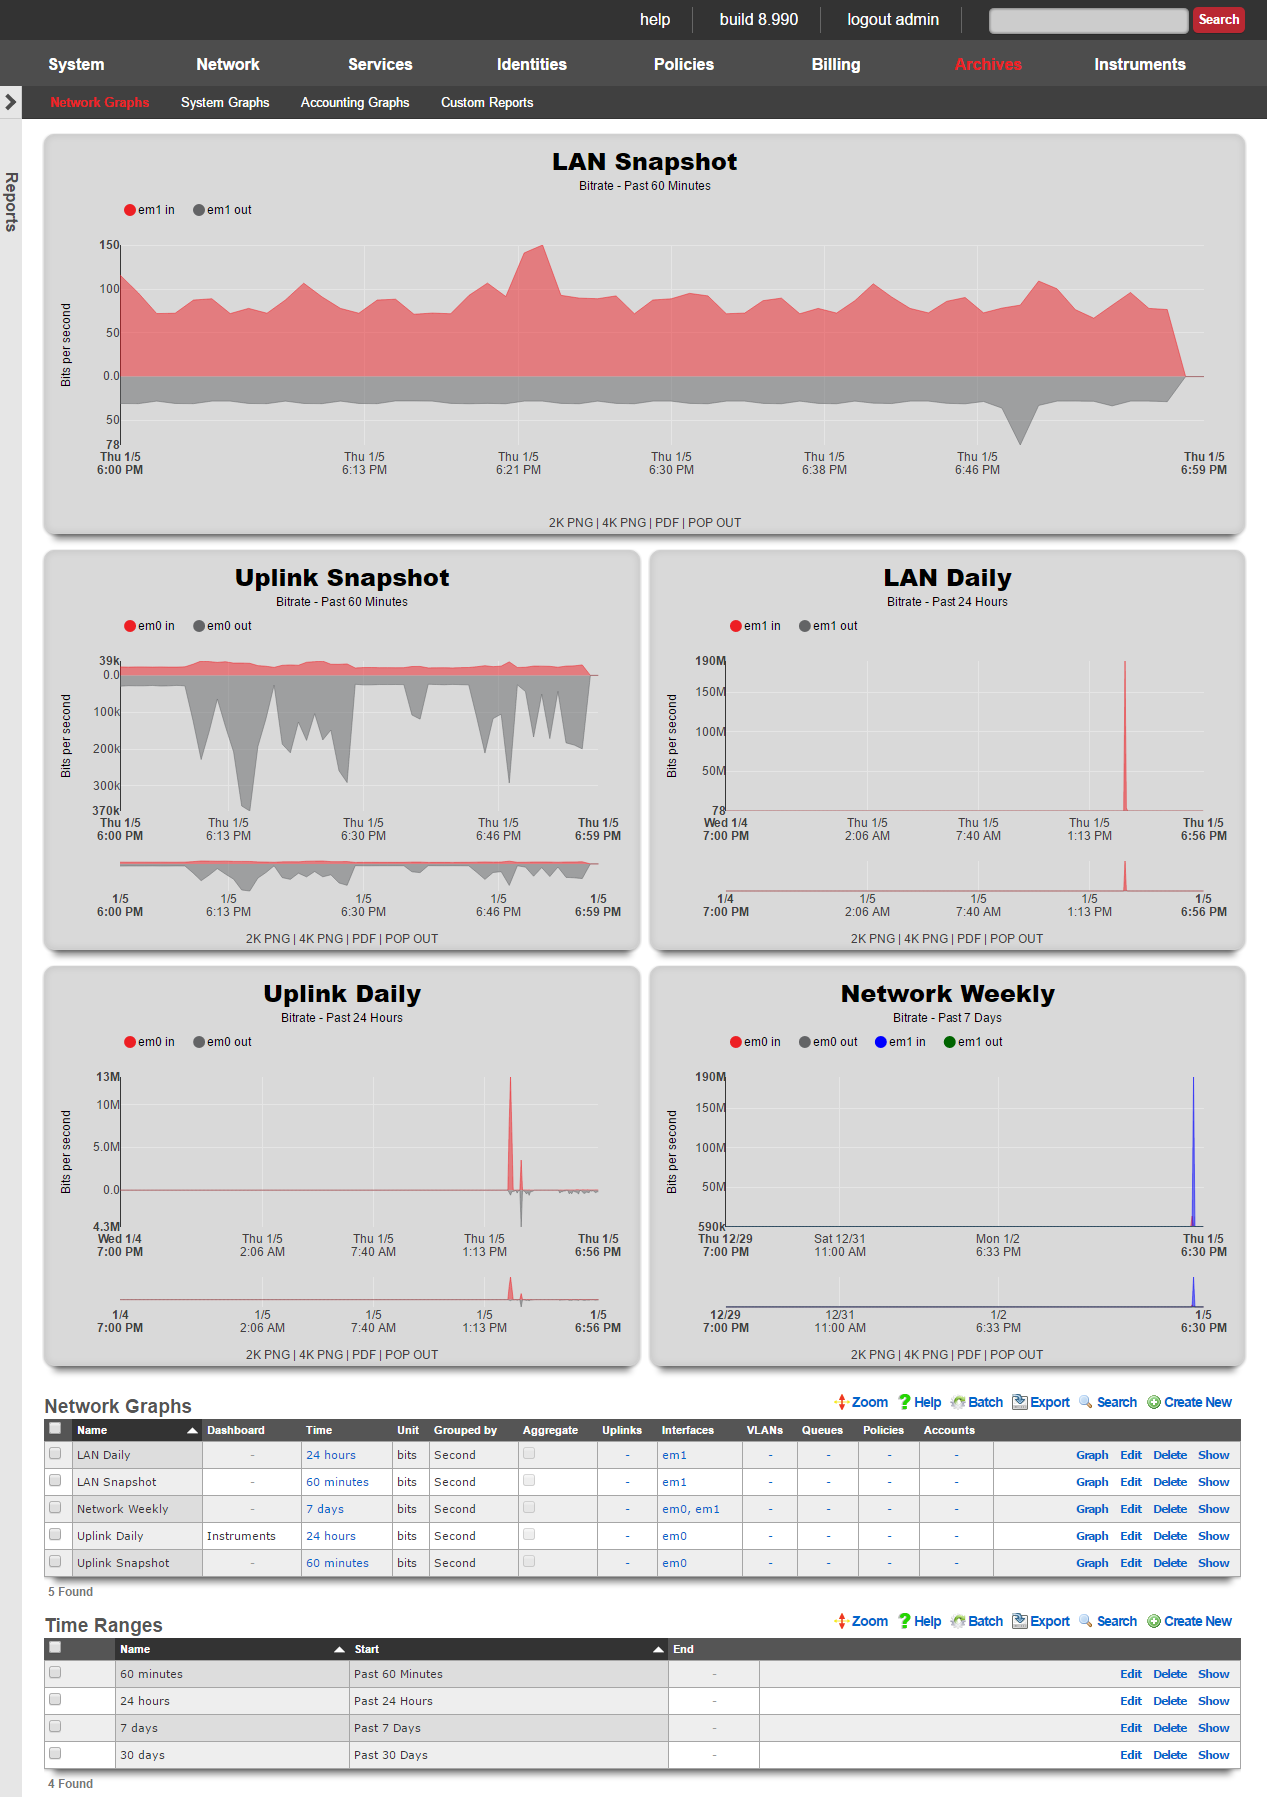
Network Graphs
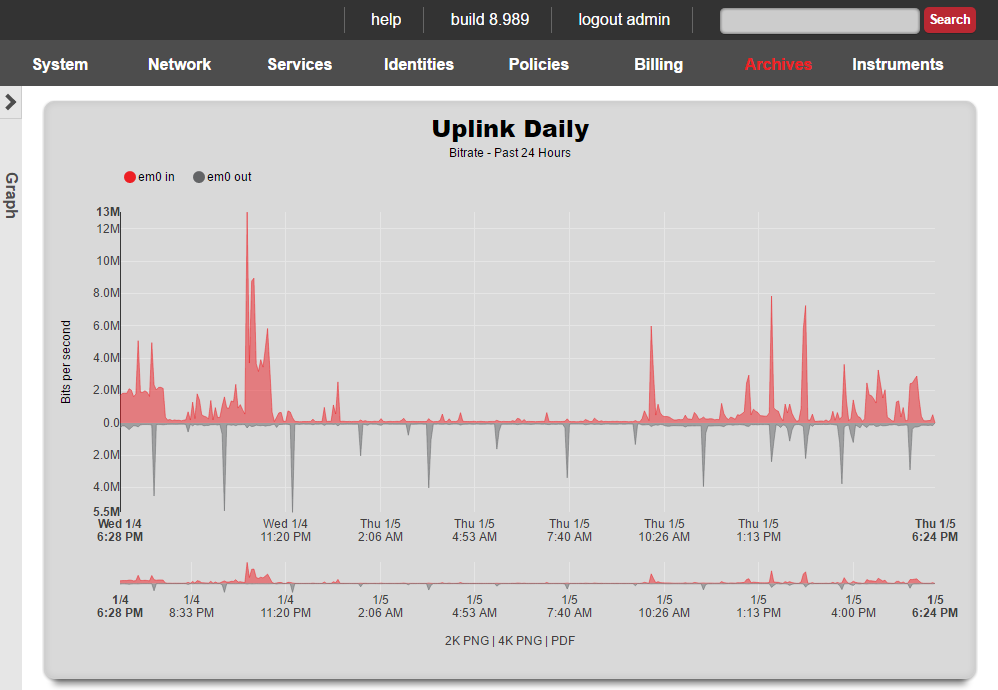
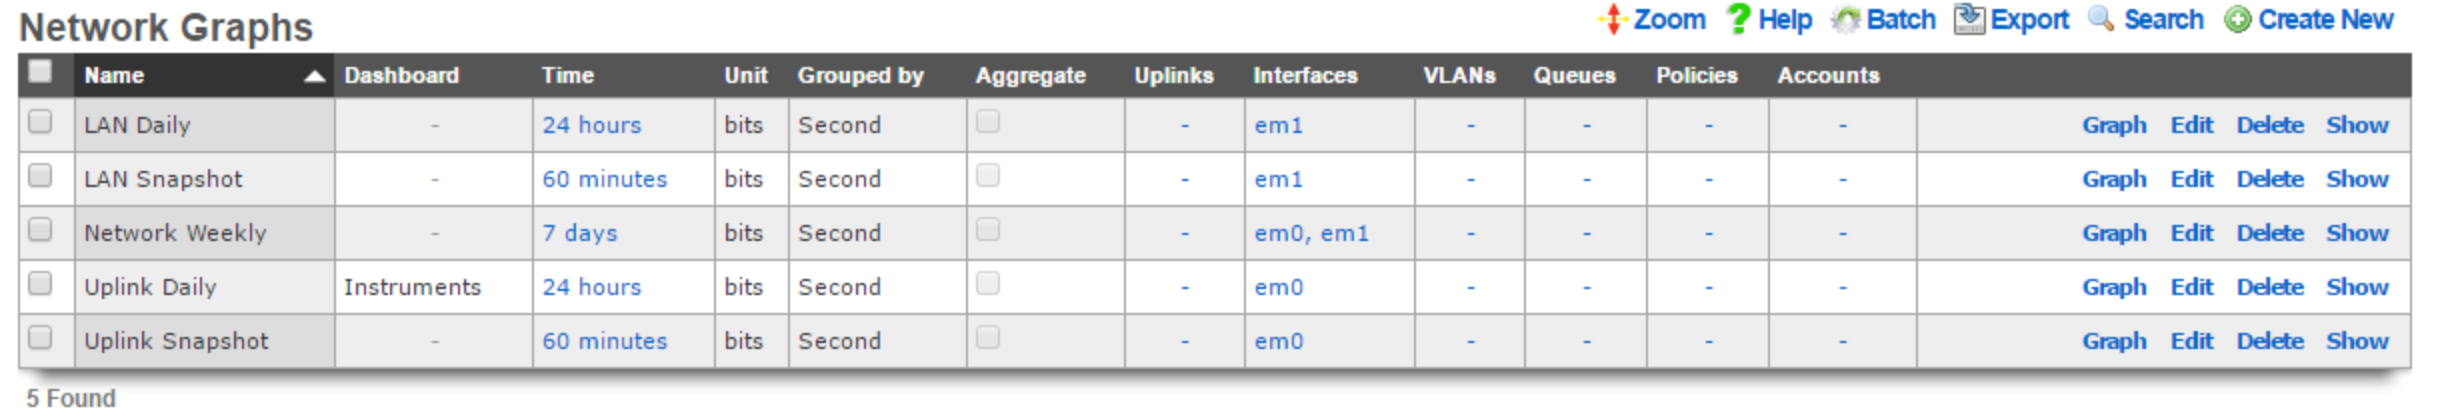
The network graphs scaffold tells the rXg to generate a graph of the specified network statistics.
The name field is an arbitrary string descriptor used only for administrative identification. Choose a name that reflects the purpose of the record. This field has no bearing on the configuration or settings determined by this scaffold.
Four kinds of data are counted and saved for each network interface: traffic, packets, errors and discards. The unit field tells the graphing system which dataset which of these four to place on the graph.
The bits and bytes options both specify graphing of the traffic dataset with the respective unit. The packets option graphs the count of packets that transited the interface. It is important to use both traffic and packet counts for troubleshooting. Relying on a graph of the traffic or packets alone is an ineffective diagnostic strategy as Ethernet ports are just as easily overrun by a large number of small packets as they are by a small number of large packets.
The errors and discards options count the number of packets that were not processed. Packets that are dropped because of errors arrived at the Ethernet interface in an illegal state. The most common reason is a bad checksum due to a malformed packet. This indicates that there is a physical problem with the connection or a logical issue with the device at the other end of the connection. Well-formed packets that are dropped because of a problem on the rXg are logged as discards. A typical scenario where discards are recorded is when the buffer for the Ethernet interface is overflowing. Errors and discards are only valid for interfaces as this information is not stored for other entities.
The interfaces , PPPoEs , VLANs , queues , policies and accounts fields enable the operator to specify which entities for which to graph data stored data.
The function field tells the graphing system what to do when the pixel resolution is less than the data resolution. A choice of average will cause the graphing system to take the average of the data and plot the result. A choice of max will cause the graphing system to plot the maximum value amongst the data points.
The aggregate check box, when checked, tells the graphing system to add up multiple sources into a single line instead of a line for each source.
The time and image fields link this graph specification to a record in the time range and image configuration scaffolds respectively. The time range controls the span of the x-axis while the image configuration controls the drawing specifications.
When the dashboard check box is enabled, the graph specified by this record will be used in the instruments dashboard. Only one graph may be configured to be the instruments dashboard graph at any given time.
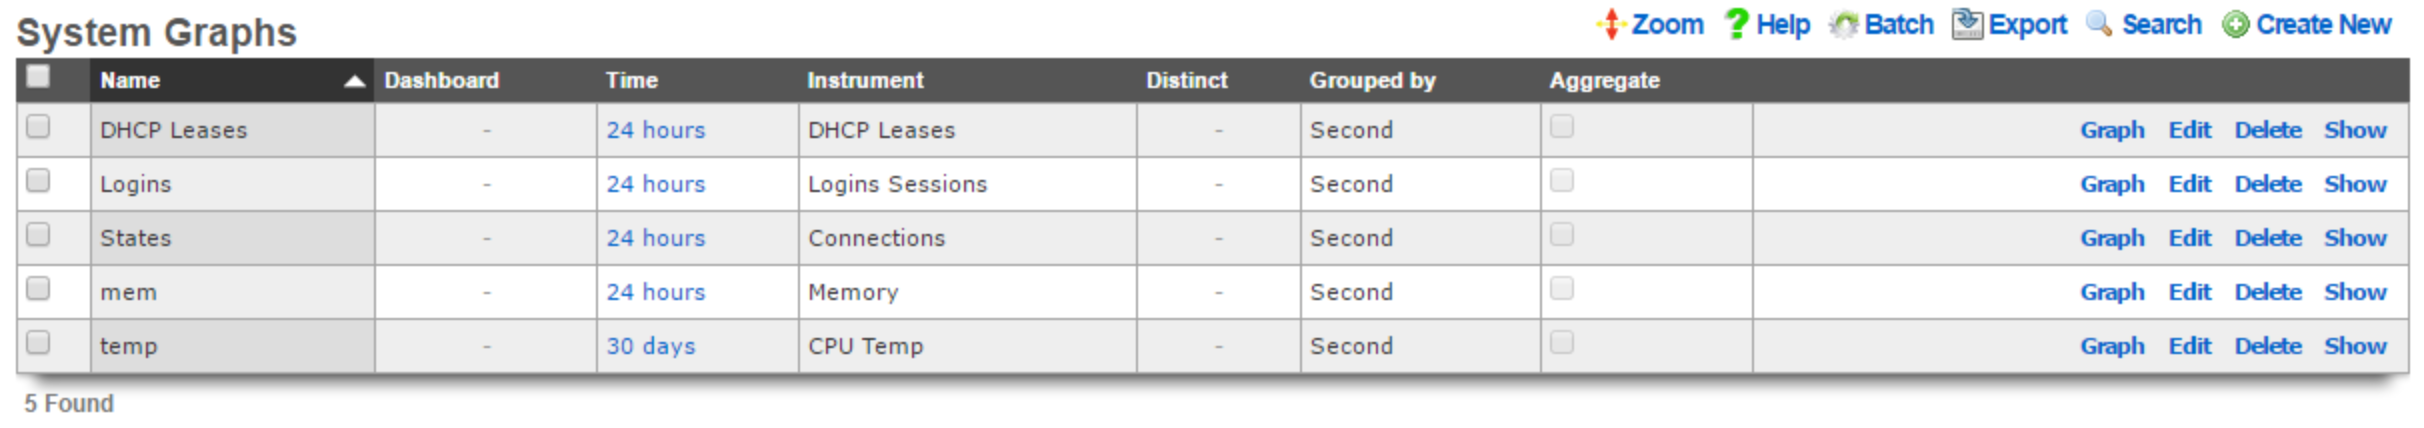
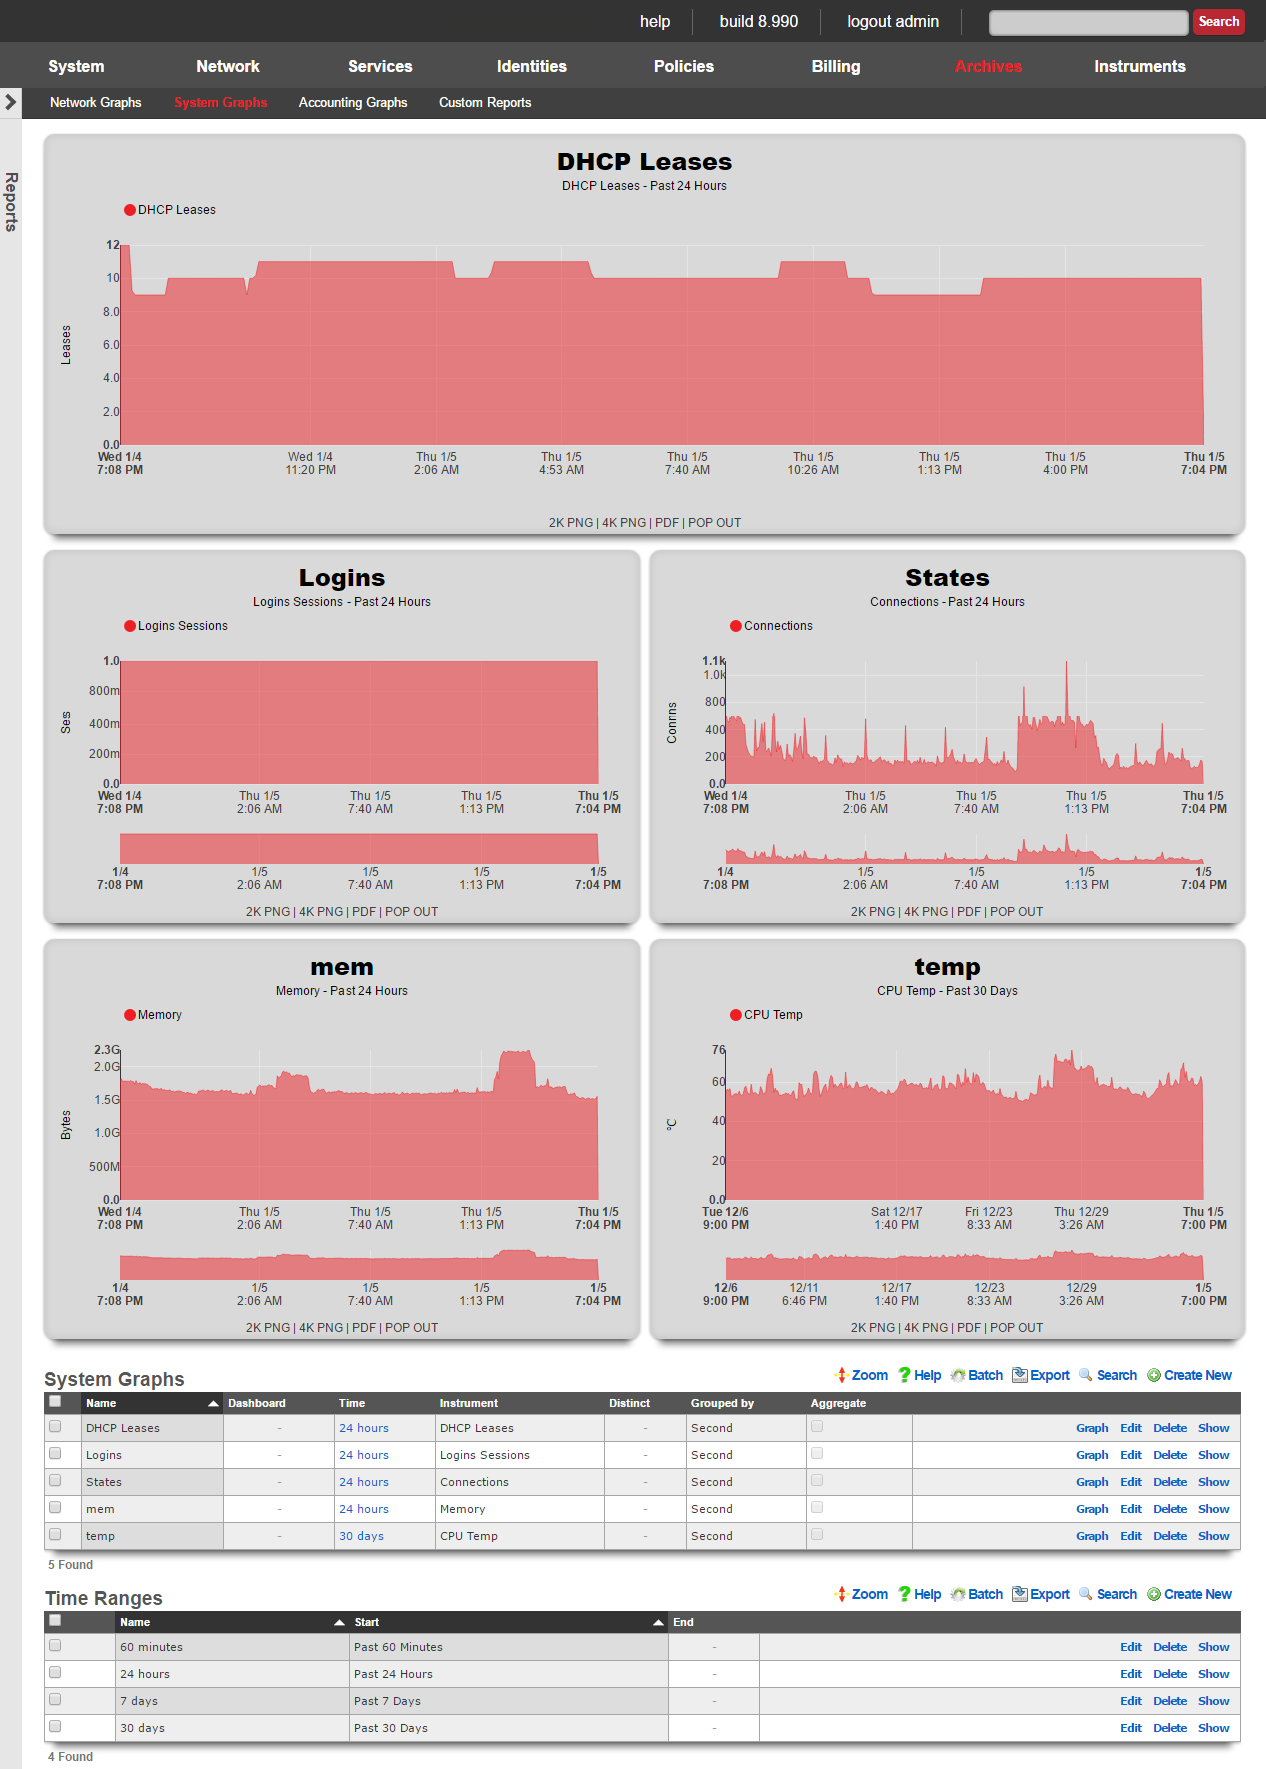
System Graphs
The system graphs scaffold tells the rXg to generate a graph of the specified network statistics.
The name field is an arbitrary string descriptor used only for administrative identification. Choose a name that reflects the purpose of the record. This field has no bearing on the configuration or settings determined by this scaffold.
The instrument field specifies the dataset to graph.
The function field tells the graphing system what to do when the pixel resolution is less than the data resolution. A choice of average will cause the graphing system to take the average of the data and plot the result. A choice of max will cause the graphing system to plot the maximum value amongst the data points.
The aggregate check box, when checked, tells the graphing system to add up multiple sources into a single line instead of a line for each source.
The time and image fields link this graph specification to a record in the time range and image configuration scaffolds respectively. The time range controls the span of the x-axis while the image configuration controls the drawing specifications.
When the dashboard check box is enabled, the graph specified by this record will be used in the instruments dashboard. Only one graph may be configured to be the instruments dashboard graph at any given time.
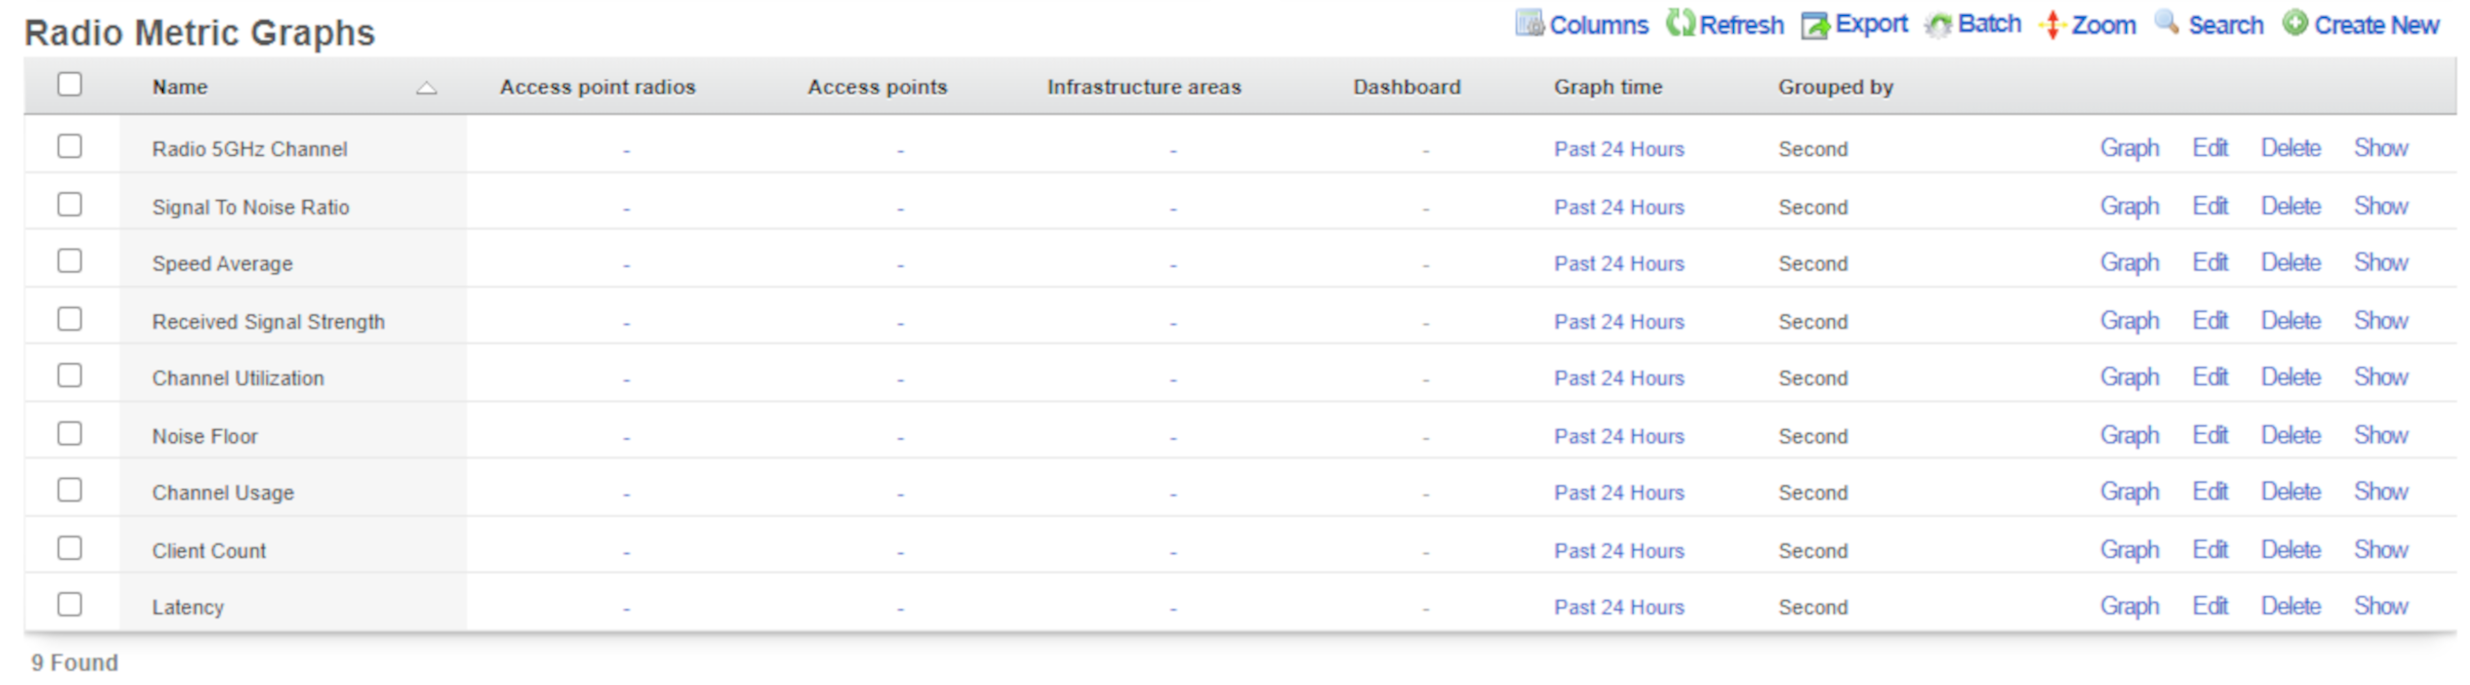
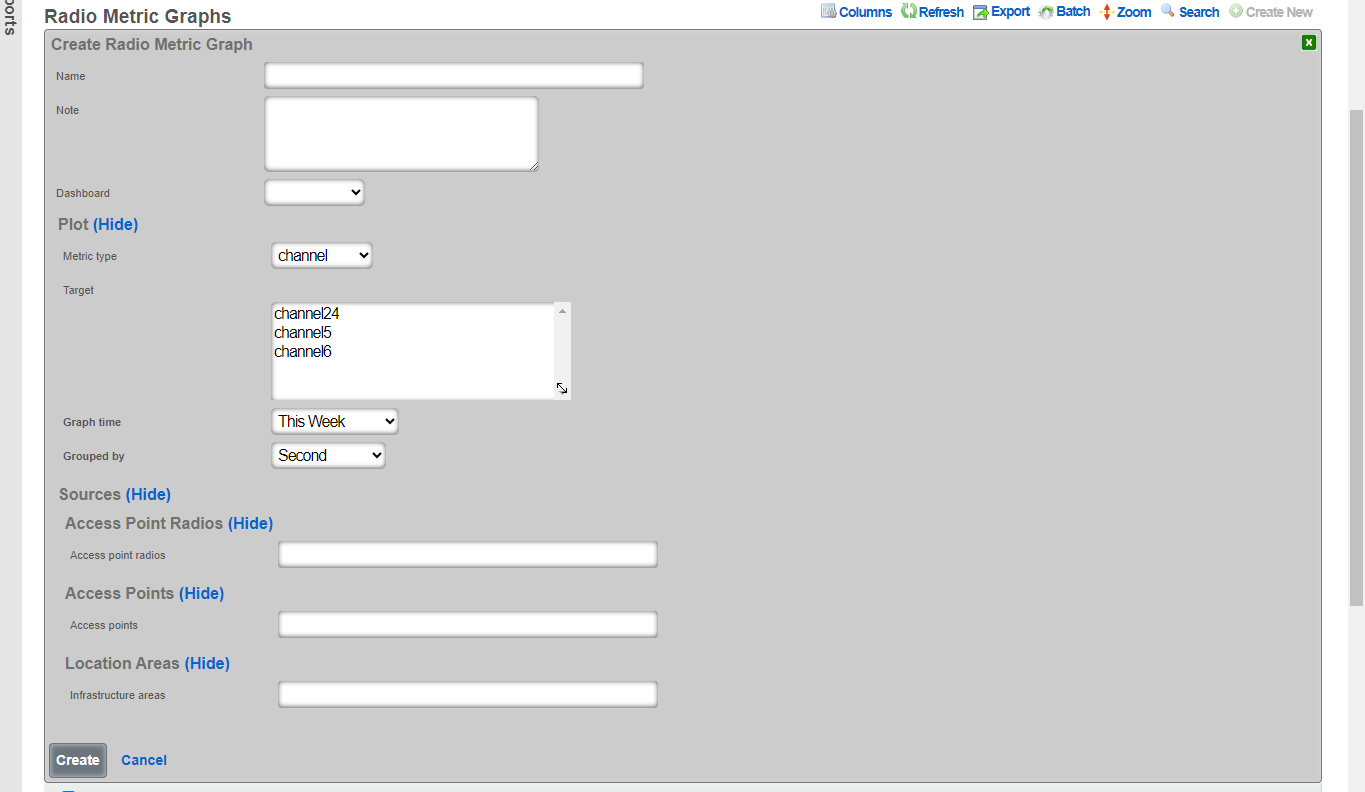
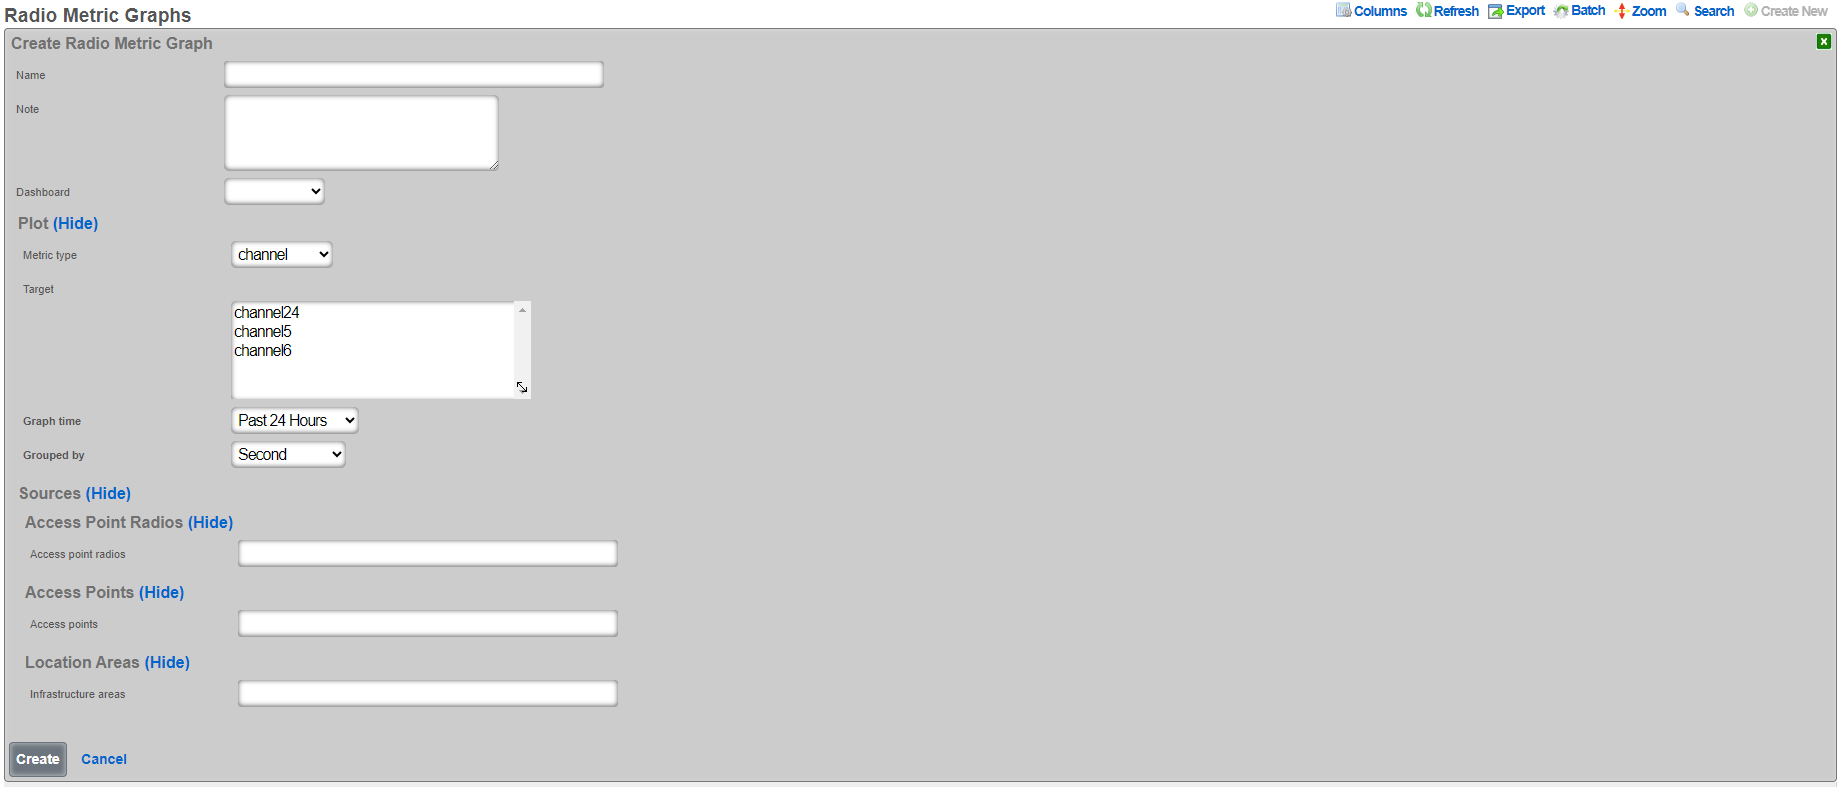
Radio Metric Graphs
The radio metric graphs view allows the operator to generate graphs based on telemetry information ingested from the wireless infrastructure. This data can be ingested using either GRPC streaming or MQTT. Telemetry is configured on a WLAN Controller. Radio metric graphs provide the operator with granular customizable views of data ingested directly from the network hardware over a specified period of time, empowering them to configure the network to be optimal for any use case.
- Optimize the network - see network throughput and latency to see where your network is struggling
- Grade the network - see real data about what users of the network are experiencing in a given time and location
- Prove the network is meeting requirements - provide documented proof that the network is or is not performing to standards set by SLAs and other agreements
Configuration
The name field is an arbitrary string descriptor used only for administrative identification. Choose a name that reflects the purpose of the record. This field has no bearing on the configuration or settings determined by this scaffold.
The graph time determines what time period the graph will represent. There are default options available and custom time frames can be selected in the time ranges scaffold located directly below the radio metric graphs scaffold.
 The grouped by option selects what time interval the graph will be divided into, with the smaller the time resulting in more detailed graphs.
The metric type and target fields tells the graphing system which set of collected data to use for generating the graph:
The grouped by option selects what time interval the graph will be divided into, with the smaller the time resulting in more detailed graphs.
The metric type and target fields tells the graphing system which set of collected data to use for generating the graph:
- Channel - What channel the radio was operating on for the selected frequency
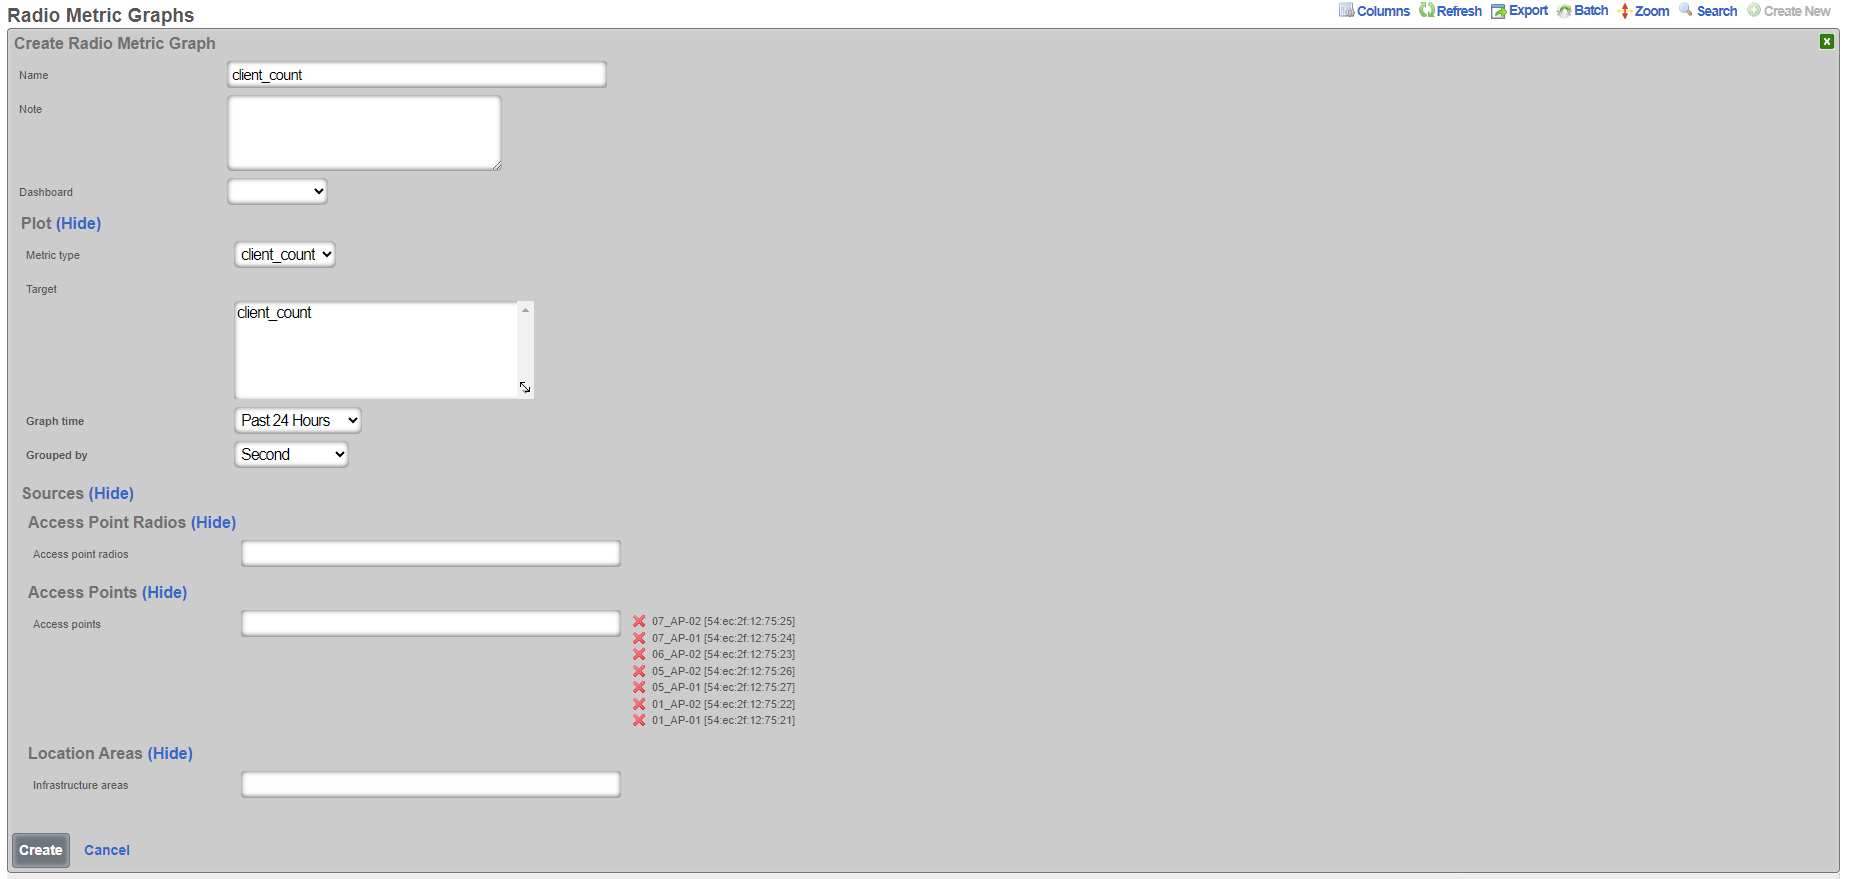
- Client count - The number of clients connected
- Latency - The latency of the infrastructure
- Rate - The data rate on the network
- RRM - Channel utilization and noise floor statistics
- RSSI - Received signal strength statistics
- SNR - Signal to noise ratio average
- Transfer - The amount of data transferred over the network
The sources tell the graphing system which devices to pull data from to generate the graph. Sources can be individual access point radios, individual access points, or location areas.
Sample Configurations
To begin creating a radio metric graph click the Create New button above the scaffold.

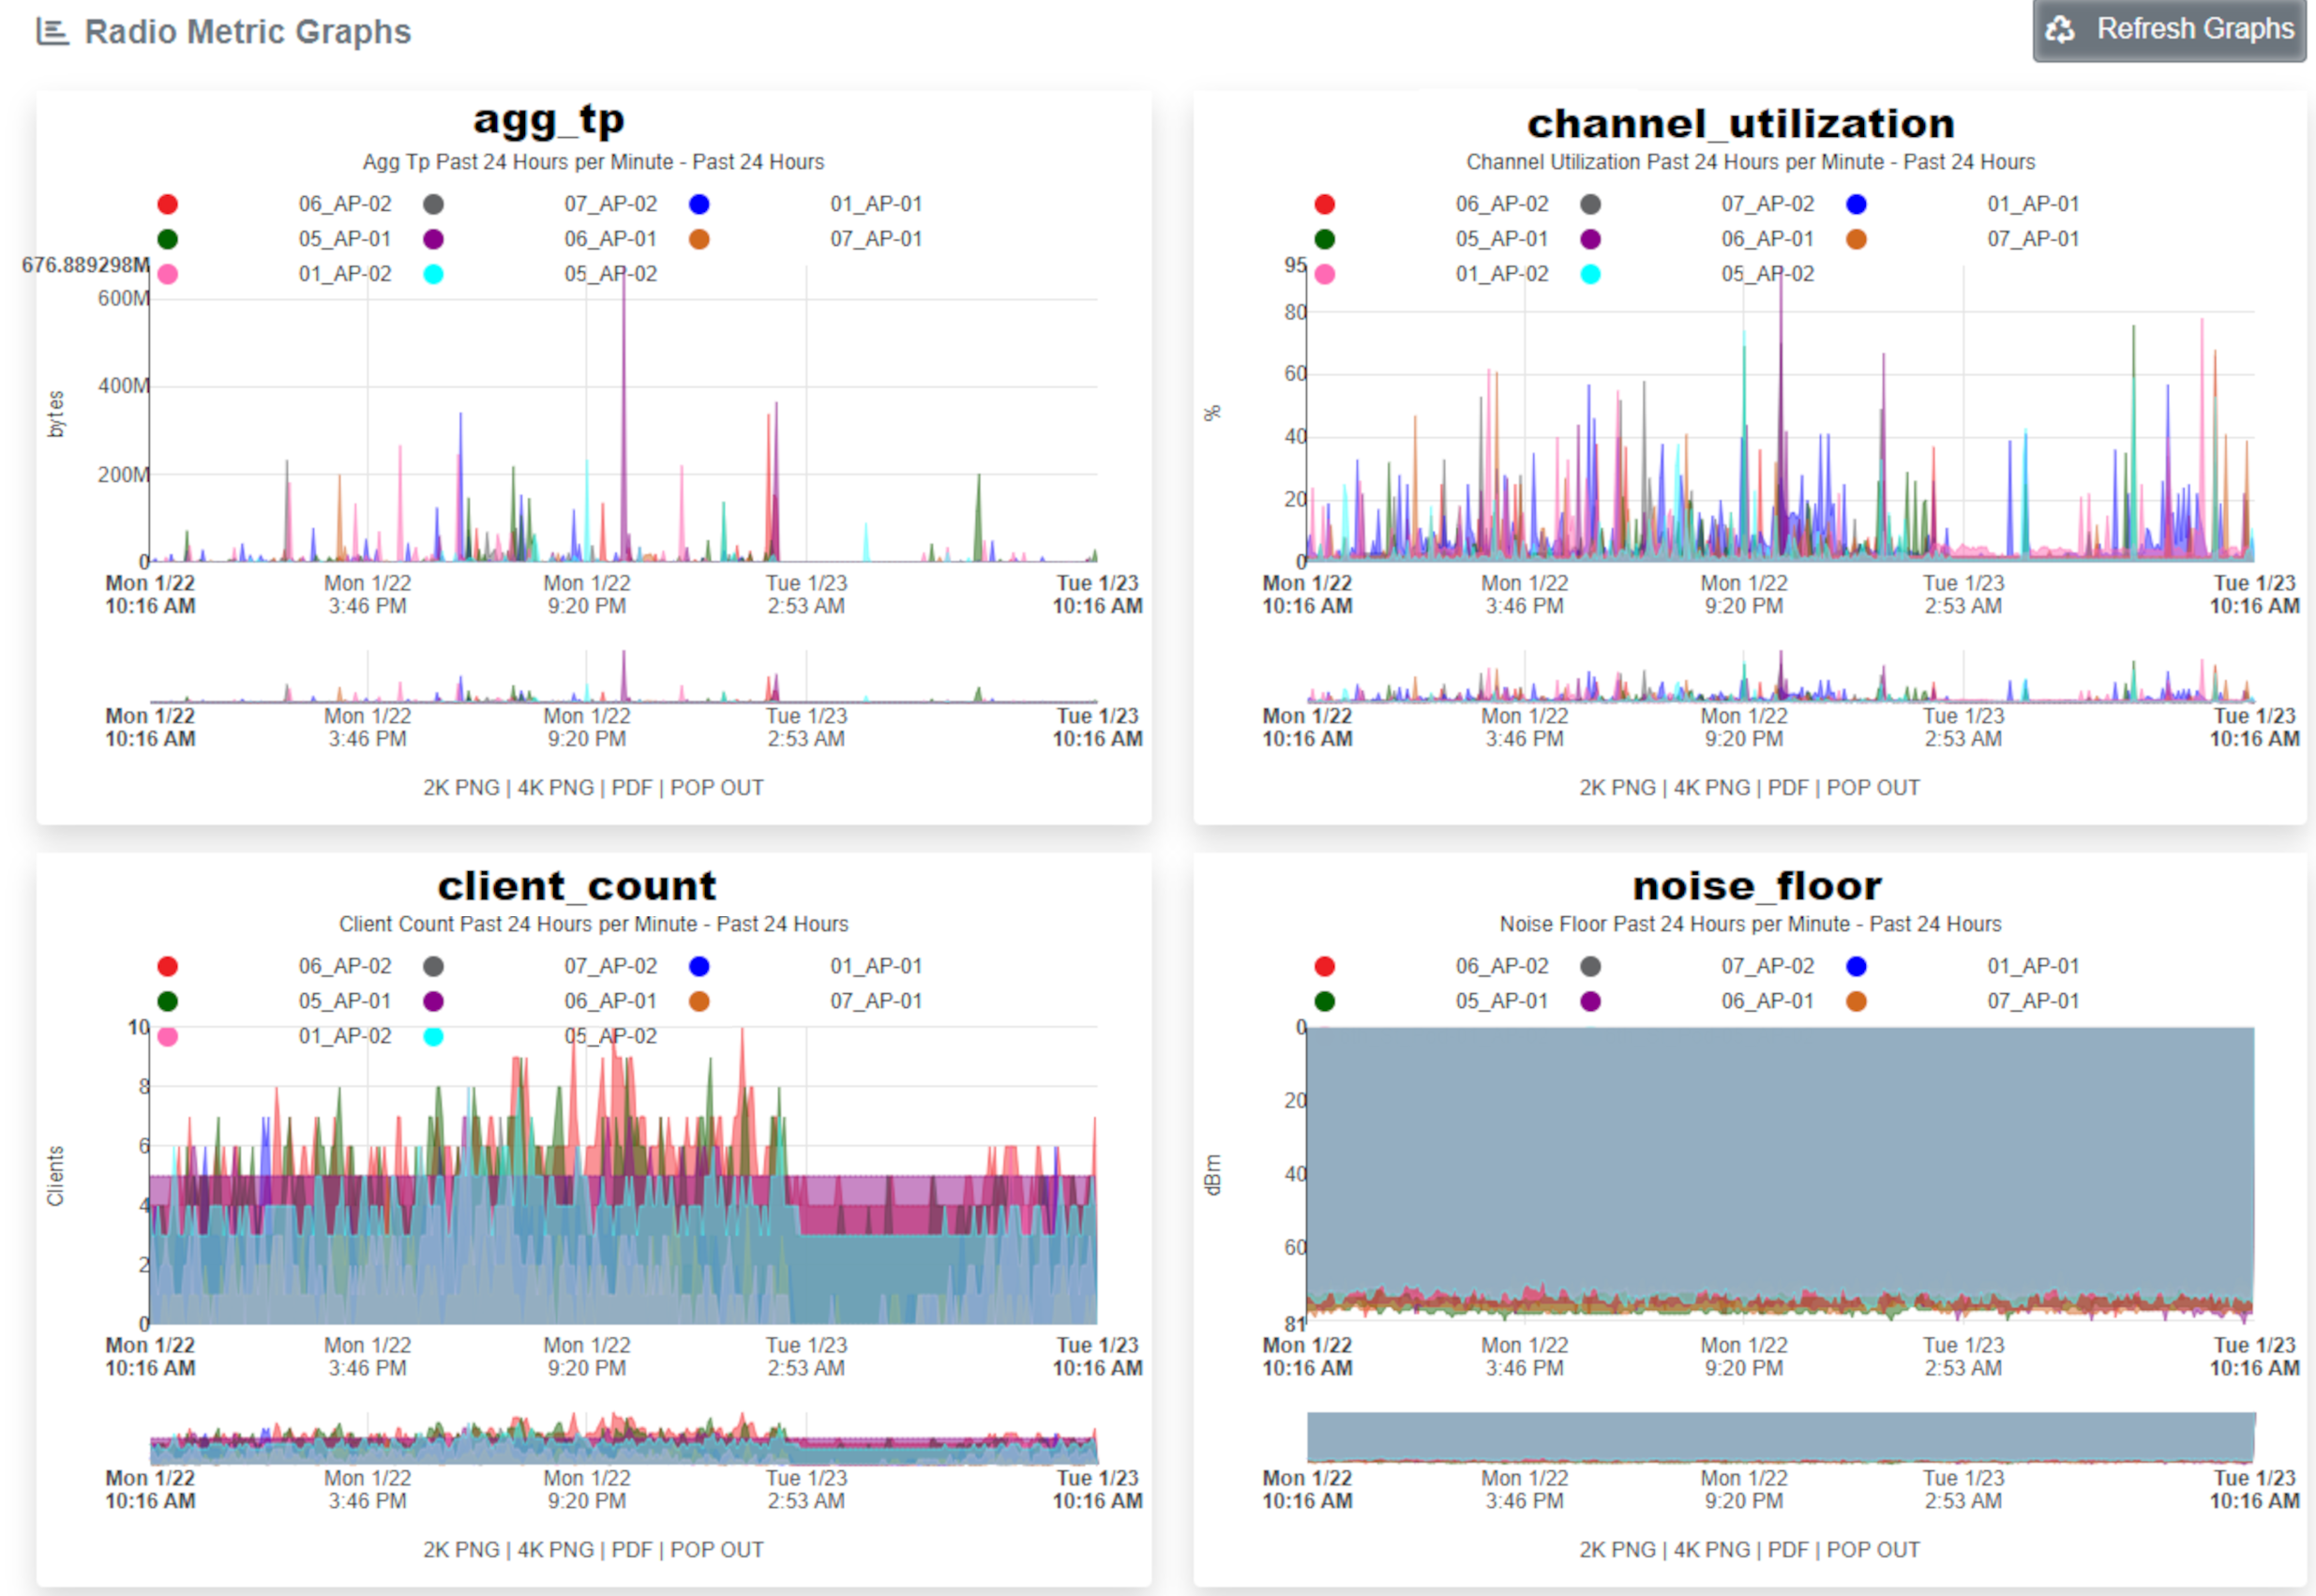
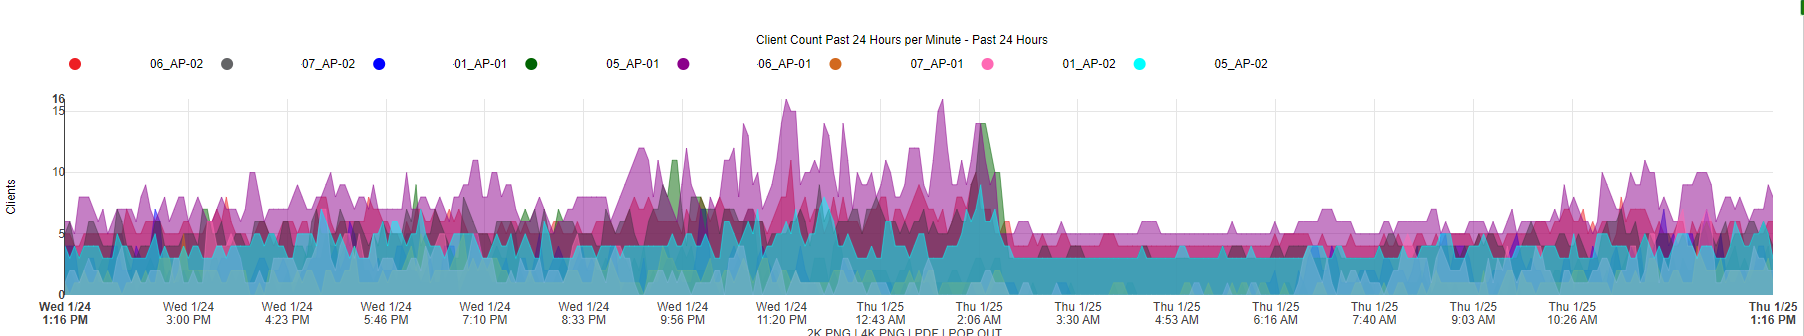
Client Count Graph
This client count graph builds a graph showing the number of clients connected to each of a group of individually selected access points. The information will be presented from information from the last 24 hours and the data will be broken down by the second.
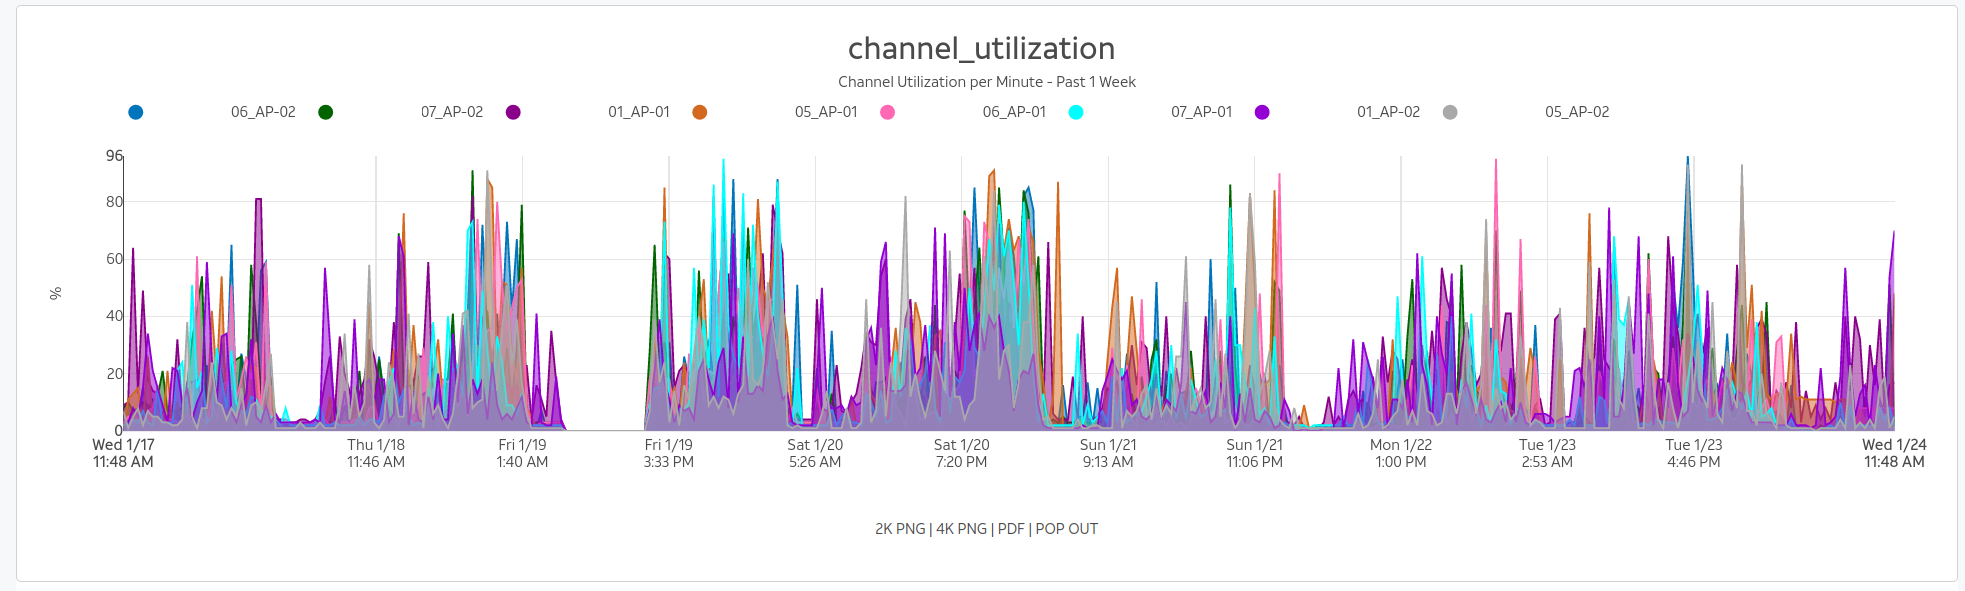
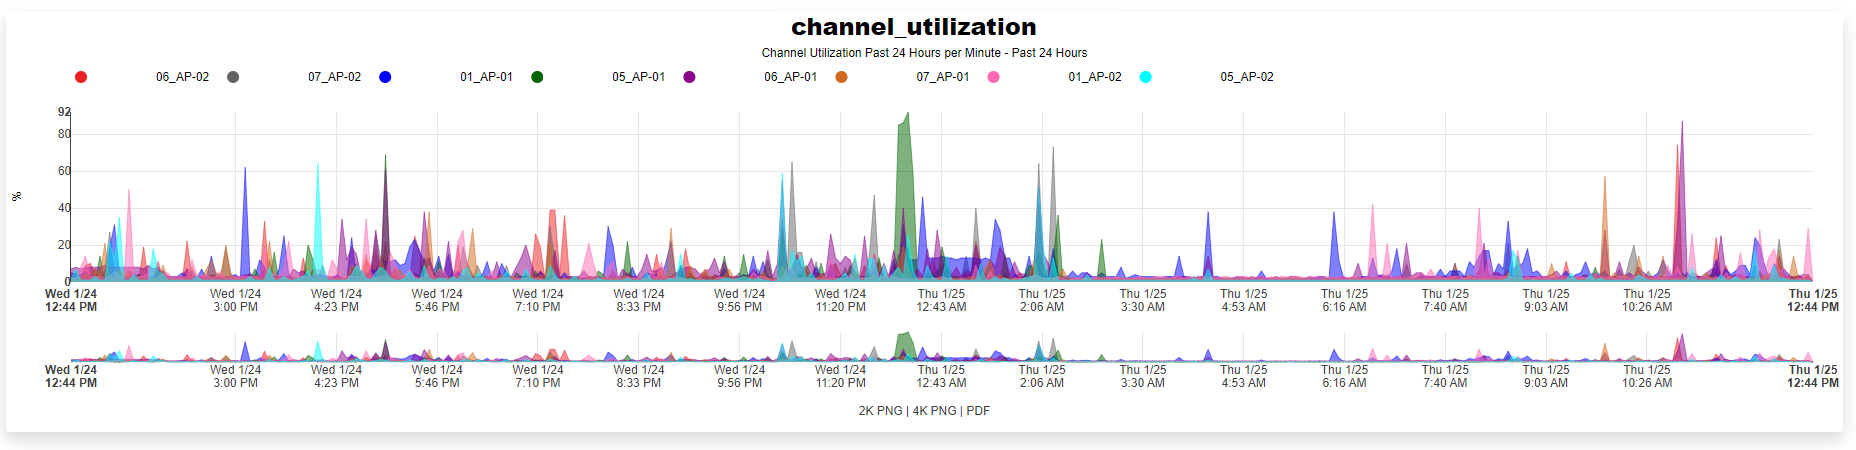
Channel Utilization Graph
This channel utilization graph will show the amount of time a channel is utilized in all of the access points in the location area Lab Access Points over the last 24 hours with the data broken down into one minute samples.
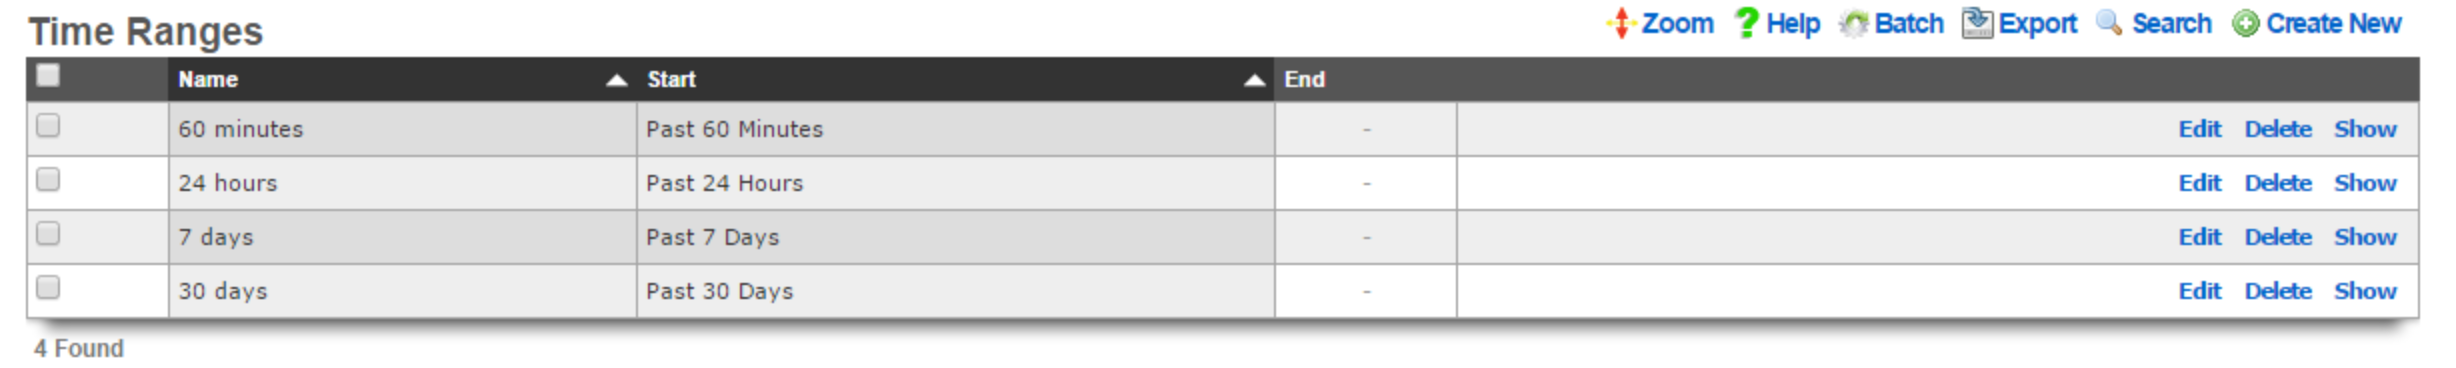
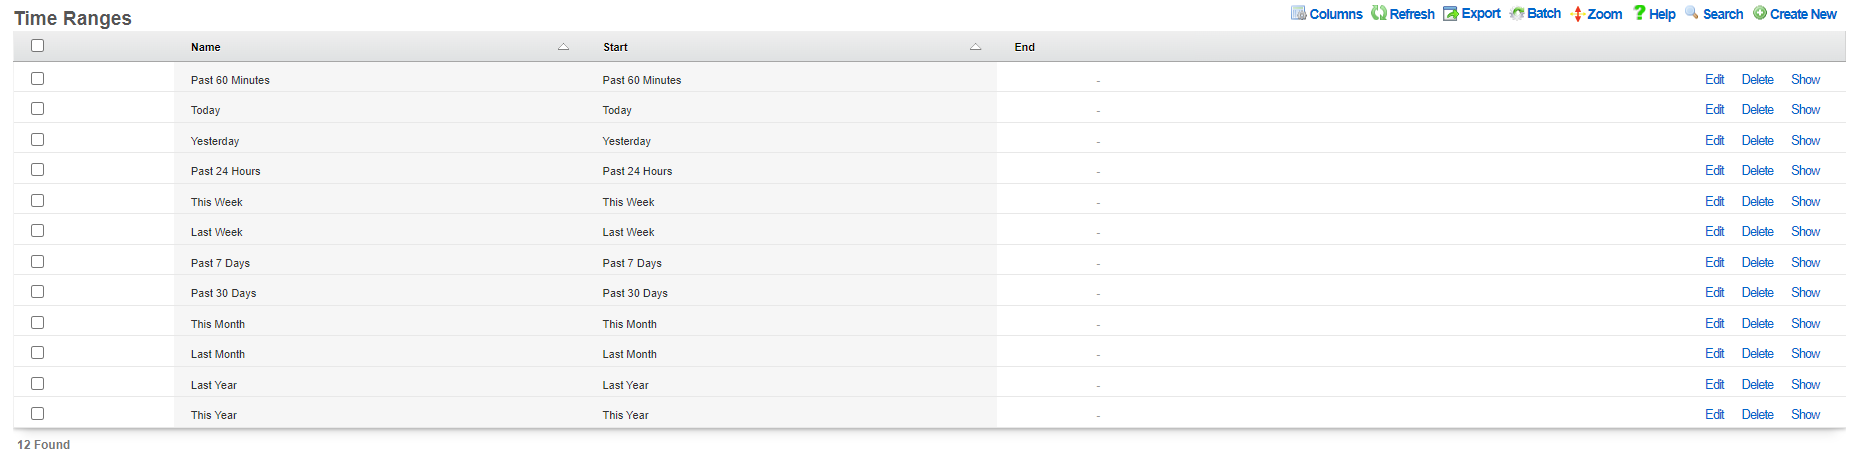
Time Ranges
Entries in the time ranges scaffold define spans of time for creating network graphs and system graphs. Graphs are linked to entries in this scaffold to determine the span of time that will be graphed on the x-axis.
The name field is an arbitrary string descriptor used only for administrative identification. Choose a name that reflects the purpose of the record. This field has no bearing on the configuration or settings determined by this scaffold.
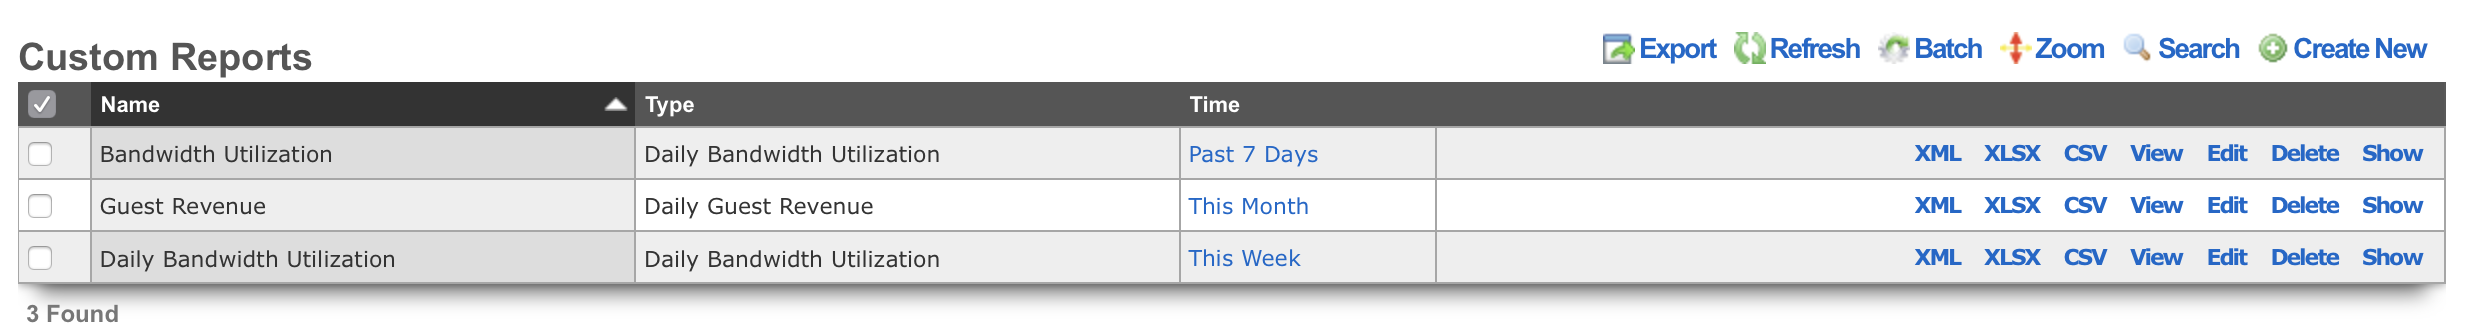
Custom Reports
In addition to the graphs available in the reporting section, Custom Reports allows for the creation of text reports that may be exported to the Excel , CSV , or XML formats.
Entries in the time ranges scaffold define spans of time for creating network graphs and system graphs. Graphs are linked to entries in this scaffold to determine the span of time that will be graphed on the x-axis.
The name field is an arbitrary string descriptor used only for administrative identification. Choose a name that reflects the purpose of the record. This field has no bearing on the configuration or settings determined by this scaffold.
The type field specifies the template used to generate the report. Templates are instances of the CustomReport ruby class, and new ones may be added, as well as the existing of the x-axis while the image configuration controls the drawing specifications.
The time field links this graph specification to a record in the time range scaffold. The time range controls the span of time used to filter the data.


